June 21-27 COVID-19 Update: Lyme Falls to Lowest Case Rate Zone with One New Case; Old Lyme Now in Yellow Zone, Reports 11 New Cases Since 6/20
 Cumulative Totals Rise to 1336 in Old Lyme, 328 in Lyme
LYME/OLD LYME — The Daily Data Reports issued Tuesday, June 21, through Monday, June 27, by the Connecticut Department of Public Health (CT DPH) show a total of 11 new, confirmed COVID-19 cases in Old Lyme and also one in Lyme compared with June 20 numbers. Note: The link above is always to the most recent day of CT DPH reports.
These cases raise Old Lyme’s cumulative case total to 1336 from 1325 on June 15 and Lyme’s to 328 from 327 on the same date.
The state does not issue reports over weekends.
The cases by town were as follows:
Lyme
6/21: 1
6/22: 0
6/23: 0
6/24: 0
6/27: 0
Old Lyme
6/21: -1
6/22: 2
6/23: 0
6/24: 3
6/27: 7
June 23 now stands as the most recent day on which no new cases were reported in either town.
Prior to March 25, the Town of Lyme had gone for 23 consecutive days with no new cases being reported. Two new cases were reported in Lyme on March 25.
Visit this link to view additional historical data and detailed graphics on COVID-19 vaccination levels and positive cases in Lyme and Old Lyme. The site is updated by Old Lyme resident William Fitzgerald
Statewide Situation – Weekly Update
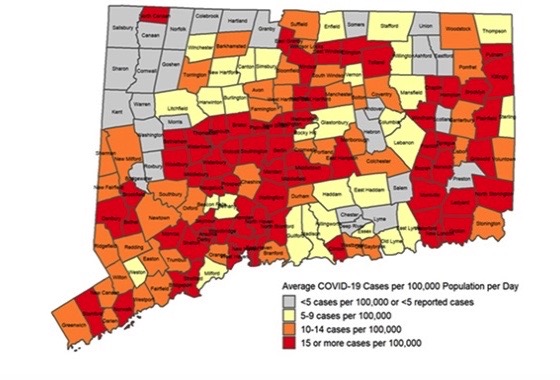
On Thursday, June 23, the CT DPH also released its latest weekly COVID-19 Alert Map, shown above, which indicates that 98 municipalities remain in the Red (highest of four) Zone for case rates. Lyme is in the lowest (Gray) zone and Old Lyme in the lowest but one (Yellow) zone.
Thirty-three towns are in the Orange Zone, 12 in the Yellow Zone and 16 in the Gray Zone.
This number for the Red Zone is 11 less than for the previous week meaning the number of towns in the Red Zone now represents 57.9% of the state.
As a reminder, the number of towns in the Red Zone on Jan. 27, 2022 was 168 out of 169 towns.
The CT DPH will issue an updated map of the zones Thursday, June 30 — the map is updated weekly on Thursdays.
The color-coded zones on the map above are:
Red: Indicates case rates over the last two weeks of greater than 15 per 100,000 population
Orange: Indicates case rates between 10 to 14 cases per 100,000 population
Yellow: Indicates case rates between 5 and 9 per 100,000 population
Gray: Indicates case rates lower than five per 100,000 population
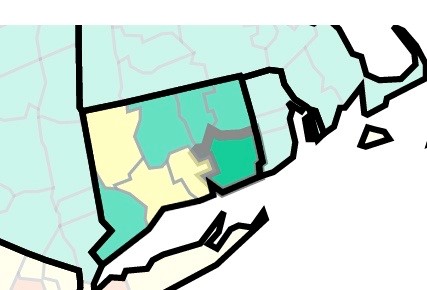
CDC Maintains ‘Community Level’ at Low for New London County, Fairfield County Also Low; All Other CT Counties are ‘Medium’

The map above shows that on June 23, New London County remains categorized as ‘Low’ for Community Level along with Fairfield, Hartford, Tolland and Windham Counties, while New Haven, Middlesex and Litchfield Counties are ‘Medium.’ These levels are updated weekly by the Centers for Disease Control and Prevention (CDC) on Thursdays.
Community Levels can be low, medium, or high and are determined by looking at hospital beds being used, hospital admissions, and the total number of new COVID cases in a specific geographical area. CDC recommends taking precautions to protect yourself and others from COVID based on Community Levels in your area.
You can view the new tool by following this link: https://www.cdc.gov/coronavirus/2019-ncov/your-health/covid-by-county.html
LLHD continues to focus its vaccination efforts on homebound populations and providing initial vaccinations and boosters to individuals who were vaccinated previously. Information about vaccination opportunities can be found at https://llhd.org/coronavirus-covid-19-situation/covid-19-vaccine/.
COVID testing opportunities can be found at COVID-19 Testing | Ledge Light Health District (llhd.org)
The following link provides centralized access to Connecticut COVID data: https://data.ct.gov/stories/s/COVID-19-data/wa3g-tfvc/.
An explanation of the CDC Community Levels tool by Thomas Gotowka can be found at this link.
Statewide Situation – Daily Update
The state’s COVID-19 Daily Positivity Rate broke the 10% watershed on May 4 at 10.32%. It went through the 14% mark with the May 20 Rate of 14.19%, but the June 27 Positivity Rate has fallen to 8.67%.
On June 27, the number of COVID-related hospitalizations was 245. In contrast, on Jan. 12, 2022, the number of COVID-related hospitalizations was 1,939.
Of those hospitalized on June 27, the number not fully vaccinated was 80 (representing 32.65%).
The total number of COVID-related deaths in Connecticut was 11,034 on June 27, according to The New York Times.
The next Daily Data Report will be issued by CT DPH Wednesday, June 29, around 4 p.m.
Increase in Cases in Lyme & Old Lyme Since August 2021
The cumulative total of confirmed cases for Old Lyme has now increased by 893 since Wednesday, Nov. 10, when the total stood at 443 — that number had stood unchanged for a week since the previous Thursday, Nov. 4.
On Aug. 26 — which was the day Lyme-Old Lyme Schools started the new academic year — Old Lyme’s cumulative case total stood at 372, meaning there have now been 964 new cases there since that date.
Meanwhile, Lyme’s cumulative total on Aug. 26 was 114 indicating 214 new cases have also been confirmed there during the same period.
Fatalities Due to COVID-19 in Lyme, Old Lyme
There has been one COVID-related fatality of a Lyme resident: a 57-year-old male passed away Nov. 16, 2021. On Nov. 30, the state finally included this fatality in its data
Four COVID-related fatalities have now been reported in Old Lyme. The first two fatalities from Old Lyme, which were reported in 2020, were a 61-year-old female and an 82-year-old male.
Details of the third and fourth fatalities, which were reported respectively in 2021 and on Feb. 4, 2022, have not been made available.
COVID-19 Situation in LOL Schools
Lyme-Old Lyme Schools are now on summer recess and so there will be no further reporting from LOL Schools until late August.
Details published between April 1, when Gov. Lamont said schools were no longer required to report positive cases, show the following number of positive cases reported in LOL Schools by week.
April 3-9: 0
April 10-16: 0
April 17-23: Spring Break
April 24-30: 7
May 2-7: 27
May 8-14: 41
May 15-21: 30
May 22-28: 23
May 29-June 4: 55
June 5-June 11: 19
June 12-June 18: 4
For a summary of cases in LOL Schools between Jan. 1 and March 31, 2022, visit this link.
View a full listing of cases in LOL Schools between 8/26/21 – 12/23/21 at this link.


