LYME-OLD LYME — The Daily Data Report issued Thursday, Dec. 30, at 4 p.m. by the Connecticut Department of Health (CT DPH) shows nine new, confirmed COVID-19 cases in Old Lyme taking that town’s total of cumulative cases to 621.
Two new cases were reported in Lyme raising their cumulative case total to 162.
The state does not issue reports over the weekend nor on public holidays (Friday, Dec. 31 was a state holiday), so the next day that the Daily Data Report will be issued by the state is Monday, Jan. 3, 2022.
Lyme-Old Lyme (LOL) Schools closed for winter break on Thursday, Dec. 23, and therefore no cases have been reported at LOL Schools. See below for a full listing of all LOL Schools-related cases since schools opened in the fall on Aug. 26, 2021.
Lyme-Old Lyme Schools reopen Monday, Jan. 3.
Statewide Data
The news statewide continues to worsen
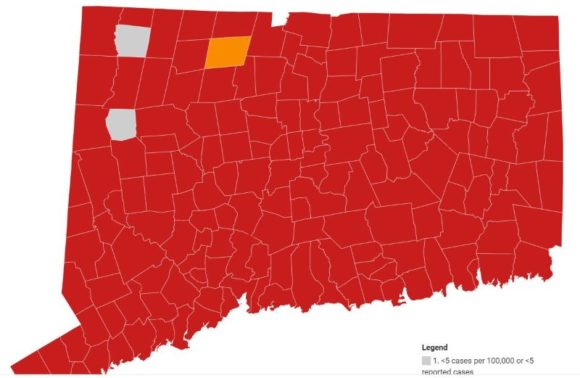
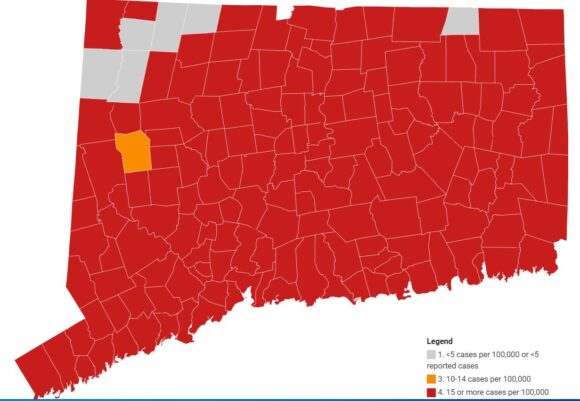
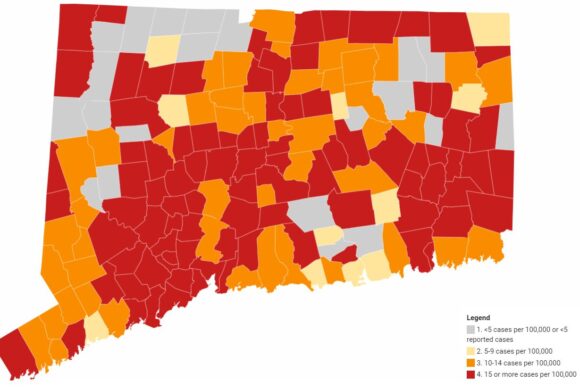
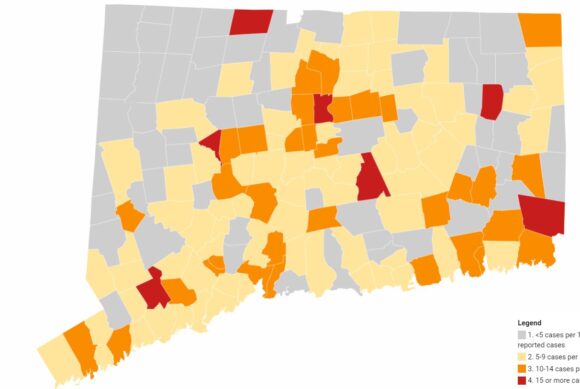
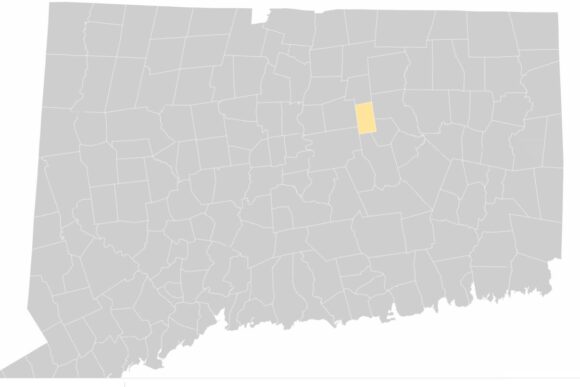
According to the weekly COVID-19 Average Daily Case Rate Report issued by the state on Dec. 30, the total number of towns in the Red (highest) Zone for case rates has increased from last week’s total of 166 to 168, leaving only one town in the state — Canaan — not in the Red Zone. This number of 168 is equivalent to 99.4 percent of towns in the state (see map above.)
To demonstrate the speed of this current surge, the total number of towns in the Red Zone on Nov. 24, 2021 was 110. As further comparative points of reference, the week prior to Thanksgiving (Nov. 18, 2021), there were 67 towns in the Red Zone, on Oct. 7, 2021 the number was down to 37, and on July 8, and June 17, 2021, there was not a single one.
Old Lyme is in the Red (highest) Zone for the sixth consecutive week: prior to these five weeks, the previous time Old Lyme was in the Red Zone was Sept. 30, 2021.
Lyme is in the Red Zone for the fourth week in succession.
*Here are some significant extracts from the Dec. 30 CT DPH report:
As of Dec. 29, 2021:
- Number of cases of COVID-19 among fully vaccinated persons in Connecticut: 58,212
- Number of fully vaccinated persons in Connecticut: 2,513,612
- Percent of fully vaccinated persons, who have contracted COVID-19: 2.32%
- Of the 1,151 patients currently hospitalized with laboratory-confirmed COVID-19, 619 (71.2%) are not fully vaccinated.
For the week beginning Dec. 19, 2021:
- Risk of unvaccinated persons testing positive for COVID-19 as compared to fully vaccinated persons: 3.3x greater
- Risk of unvaccinated persons dying from COVID-19 as compared to fully vaccinated persons: 32.9x greater
- Data on COVID-19 associated deaths is updated once per week every Thursday. The most recently reported total number of deaths is 9,160.
Details of the Daily Case Rate Zones are as follows:
- The Gray category is defined as when the Average Daily Rate of COVID-19 Cases Among Persons Living in Community Settings per 100,000 Population By Town is less than five or less than five reported cases.
- The Yellow category is defined as when the Average Daily Rate of COVID-19 Cases Among Persons Living in Community Settings per 100,000 Population By Town is between five and nine reported cases.
- The Orange category is defined as when the Average Daily Rate of COVID-19 Cases Among Persons Living in Community Settings per 100,000 Population By Town is between 10 and 14.
- The Red category is defined as when the Average Daily Rate of COVID-19 Cases Among Persons Living in Community Settings per 100,000 Population By Town exceeds 15.
In all cases, this rate does not include cases or tests among residents of nursing home, assisted living, or correctional facilities.
The CT DPH will issue an updated map of the zones Jan. 6, 2022 — the map is updated weekly on Thursdays.
Increase in Cases in Lyme & Old Lyme Since August 2021
The cumulative total of confirmed cases for Old Lyme has now increased by 178 since Wednesday, Nov. 10, when the total stood at 443 — that number had stood unchanged for a week since the previous Thursday, Nov. 4.
On Aug. 26 — which was the day Lyme-Old Lyme Schools started the new academic year — Old Lyme’s cumulative case total stood at 372, meaning there have now been 249 new cases there since that date. Meanwhile, Lyme’s cumulative total on Aug. 26 was 114 indicating 48 new cases have also been confirmed there during the same period.
Ledge Light Health District Data, Communications
All the towns in the Ledge Light Health District (LLHD) remain in the Red Zone.
In an email sent Thursday, Dec. 30, regarding the latest COVID-19 data, Ledge Light Health District (LLHD) Director of Health Stephen Mansfield stated, “We continue to see a high number of new COVID cases within our jurisdiction, which is consistent with an increase in COVID cases statewide. Unfortunately, we expect this trend to continue as we move into the holiday season.”
He continued, “It is imperative that we remain diligent in our mitigation strategies. We strongly advise everyone to continue to wear masks indoors in public settings, regardless of vaccination status.”
Mansfield concluded, “LLHD continues to focus our vaccination efforts on homebound populations and providing initial vaccinations and boosters to individuals who were vaccinated previously. Information about vaccination opportunities can be found at https://llhd.org/coronavirus-covid-19-situation/covid-19-vaccine/
COVID-19 Cases in Lyme-Old Lyme Schools
This is the latest information that we have with the most recent cases first — there may have been further updates, however, which we have not yet received.
On Thursday, Dec. 23, Lyme-Old Lyme (LOL) Schools Superintendent Ian Neviaser informed the school community that two positive cases of COVID-19 impacting Lyme-Old Lyme High School (LOLHS), a positive case of COVID-19 impacting Lyme-Old Lyme Middle School (LOLMS) and a positive case of COVID-19 impacting Mile Creek School had been reported.
On Tuesday, Dec. 21, Lyme-Old Lyme (LOL) Schools Superintendent Ian Neviaser informed the school community that a positive case of COVID-19 impacting Lyme-Old Lyme Middle School (LOLMS) had been reported.
On Monday, Dec. 20, Neviaser informed the school community that a positive case of COVID-19 impacting Lyme-Old Lyme High School (LOLHS) had been reported.
On Thursday, Dec. 16, Neviaser informed the school community that two separate positive cases of COVID-19 impacting LOLHS and Lyme School respectively had been reported.
On Monday, Dec. 13, Neviaser informed the school community that one positive case of COVID-19 impacting Mile Creek School had been reported.
On Thursday, Dec. 9, Neviaser informed the school community that a total of three positive cases of COVID-19 impacting Lyme-Old Lyme Middle School (LOLMS), Center School, and Lyme School had been reported.
On Monday, Dec. 6, Neviaser informed the school community that a positive case of COVID-19 impacting LOLMS had been reported.
On Friday, Dec. 3, Neviaser informed the school community that a positive case of COVID-19 impacting Center School had been reported.
On Thursday, Dec. 2, Neviaser informed the school community that two separate positive cases of COVID-19 impacting Lyme-Old Lyme High School (LOLHS) had been reported.
On Monday, Nov. 30, Neviaser informed the school community that a positive case of COVID-19 impacting LOLHS had been reported.
On Monday, Nov. 29, Neviaser informed the school community that a positive case of COVID-19 impacting Mile Creek School had been reported.
On Tuesday, Nov. 23, Neviaser informed the school community that a positive case of COVID-19 impacting LOLHS had been reported.
On Monday, Nov. 22, Neviaser informed the school community that a positive case of COVID-19 impacting Mile Creek School had been reported.
On Thursday, Nov. 18, Neviaser informed the school community that a positive case of COVID-19 impacting LOLHS had been reported.
On Wednesday, Nov. 17, Neviaser informed the school community that a positive case of COVID-19 impacting LOLHS had been reported.
On Sunday, Nov. 14, Neviaser informed the school community that over the weekend a positive case of COVID-19 impacting LOLHS had been reported.
On Wednesday, Oct. 20, Neviaser informed the school community that a positive case of COVID-19 impacting LOLHS had been reported.
On Wednesday, Oct. 5, Neviaser informed the school community that a positive case of COVID-19 impacting LOLHS had been reported the previous evening.
On Thursday, Oct. 23, Neviaser informed the school community of two intrafamilial positive cases of COVID-19 impacting Lyme-Old Lyme Middle School (LOLMS.) He stated, “We were able to complete our contact tracing and the one individual who must quarantine has been notified.”
On Thursday, Sept. 23, Neviaser informed the school community of two intrafamilial positive cases of COVID-19 impacting LOLMS. He noted, “We were able to complete our contact tracing and the one individual who must quarantine has been notified.”
On Wednesday, Sept. 22, Neviaser informed the school community of a positive case of COVID-19 impacting LOLHS.
On Thursday, Sept. 16, Neviaser informed the school community that a previously reported positive case of COVID-19 is now impacting Mile Creek School and Center School.
On Monday, Sept. 13, Neviaser informed the school community that a positive case of COVID-19, which had been reported the previous day, was impacting LOLMS.
On Wednesday, Sept. 1, Neviaser informed the school community that a positive case of COVID-19 was impacting Mile Creek School.
On Tuesday, Aug. 31, Neviaser informed the school community that late on Monday, Aug. 30, a positive case of COVID-19 impacting LOLHS had been reported.
On Saturday, Aug. 28, Neviaser informed the school community that late on Friday, Aug. 27, a positive case of COVID-19 impacting Lyme School had been reported.
In all cases, contact tracing was completed and those individuals who needed to quarantine were notified. They will be able to return to school following their quarantine period. All other students and staff will continue to attend school as scheduled.
Fatalities Due to COVID-19 in Lyme, Old Lyme
There has been one COVID-related fatality of a Lyme resident: a 57-year-old male passed away Nov. 16, 2021. On Nov. 30, the state finally included this fatality in its data
Three COVID-related fatalities have been reported in Old Lyme. The first two fatalities from Old Lyme, which were reported in 2020, were a 61-year-old female and an 82-year-old male.
Details of the third, which was reported in 2021, have not been made available.
COVID-19 Cases Over Time: Dec. 2020-Dec. 2021
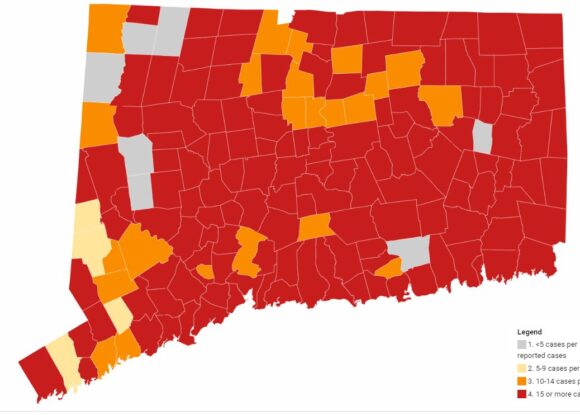
The following maps show has the picture of COVID-19 Average Daily Case Rates has gone from an almost totally red (highest rate) map back in Dec. 2020 to an almost all-gray (lowest rate) map on June 17 and July 8, 2021, and back to almost completely red on Dec. 23, 2021.
Dec. 23, 2021
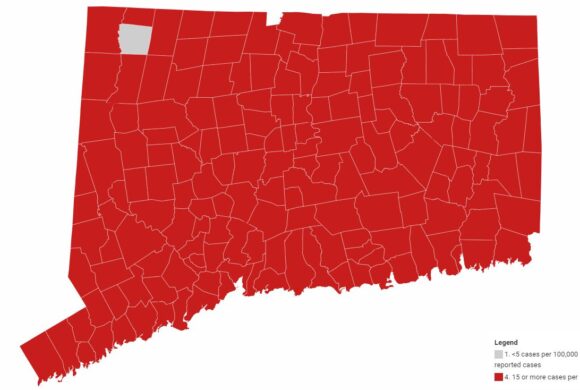
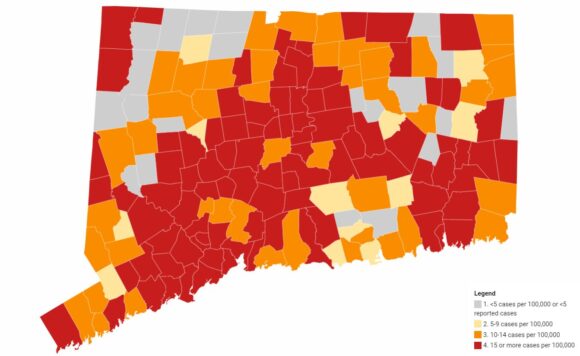
Dec. 16, 2021
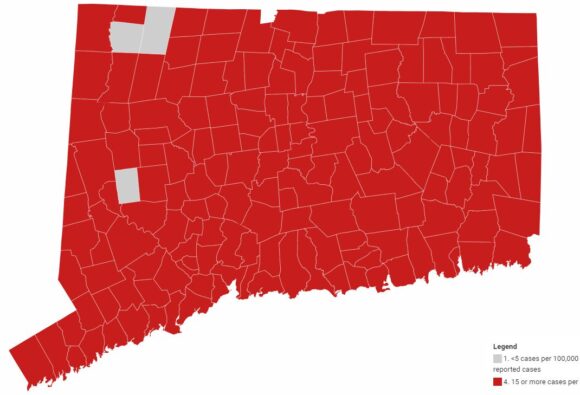
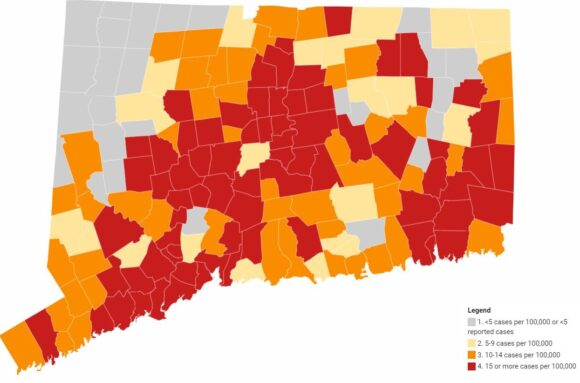
Dec. 9, 2021
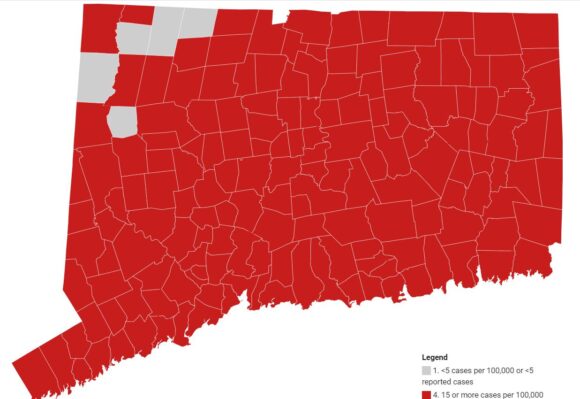
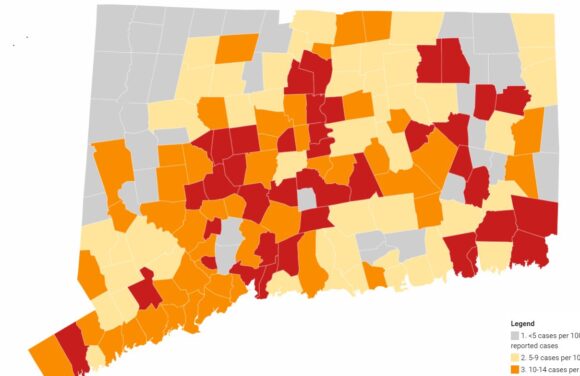
Dec. 2, 2021
Oct. 14, 2021
Both Lyme and Old Lyme are in the Gray (lowest) Zone, where Lyme has been since mid-September. The last time both towns were in the Gray Zone was July 22, 2021.
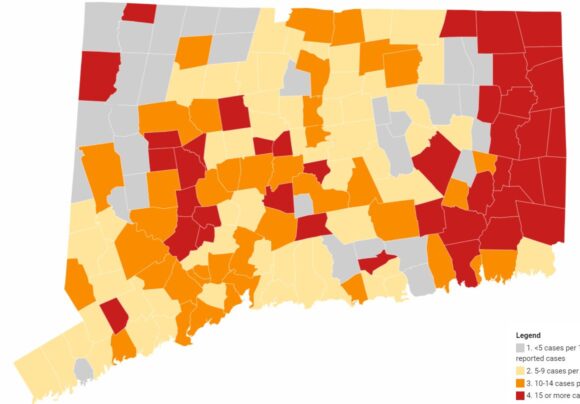
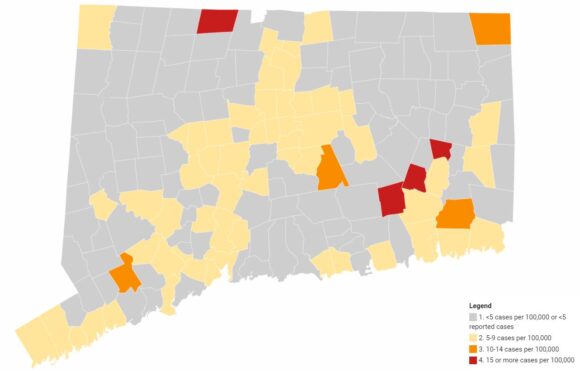
Sept. 23, 2021
Both Lyme and Old Lyme remained in the Red (highest) Zone for the average daily rate of new cases of COVID-19. This was the third week in succession that both towns were in the Red Zone.
Statewide, there were 81 towns now in the Red Zone, which is three down from the previous week’s total of 84. On Sept. 2, the total was 91 so the trend was undoubtedly downward although it was still up significantly from the 39 reported on Aug. 12.
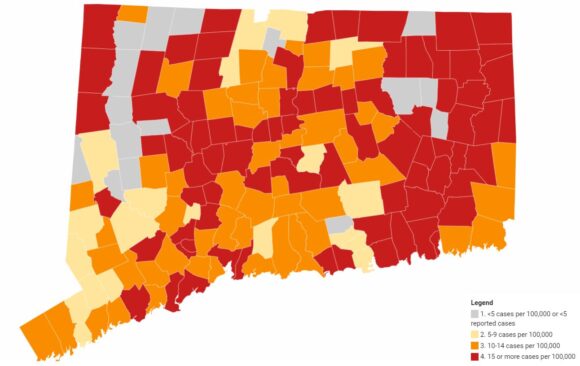
Sept. 2, 2021
The map above is from Sept. 2 when 91 towns were in the Red Zone, which is down one from 92 a week ago on Aug. 26, but still up significantly from 73 on Aug. 19, and 39 on Aug. 12.
Old Lyme had fallen to the Yellow (second lowest) Zone along with 10 other towns. This total of 11 towns is unchanged from last week, when Old Lyme was in the Orange Zone.
Lyme was in the Gray (lowest) Zone. This was the 24th straight week for Lyme in the Gray Zone. Again, this total of 20 towns in the Gray Zone was unchanged from last week.
Forty-seven towns were in the Orange (second highest) Zone.
Aug. 26, 2021
The map above is from Aug. 26, when Old Lyme was in the Orange (second highest case rate) Zone with a daily case rate per 100,000 of 10.8.
Eleven Connecticut towns were in the Yellow (second lowest) Zone down from 20the previous week. Locally, these included Deep River, Old Saybrook and Haddam.
The remaining 20 towns in the state, including Lyme, were in the Gray (lowest rate) Zone. This was the 23rd straight week for Lyme in the Gray Zone.
Aug. 19, 2021
The map above is from Aug. 19 when Old Lyme was back in the Orange (second highest case rate) Zone. Almost 50 towns in the state remained in the Orange Zone, which was around the same number as the previous week.
Less than 20 Connecticut towns were in the Yellow (second lowest) Zone down from 40 the previous week. Locally, these included including Deep River, Essex and East Haddam.
The remaining 20 towns in the state, including Lyme, are in the Gray (lowest rate) Zone. This was the 22nd straight week for Lyme in the Gray Zone.
Aug. 12
The map above is from Aug. 12 and shows that Old Lyme had fallen out of the Orange (second highest case rate) Zone into the Yellow (second lowest) Zone — but only by a fraction.
Almost 50 towns were in the Orange (second highest case rate) Zone — up from 33 the previous week — including Westbrook and Salem locally.
Old Lyme joined the Yellow (second lowest) Zone along with around 40 other Connecticut towns, including Old Saybrook, East Lyme, and Essex.
All remaining towns in the state, including Lyme, along with Deep River and Chester, were in the Gray (lowest rate) Zone. This was the 21st straight week for Lyme in the Gray Zone.
Aug. 5
The map above is from Aug. 5 when six towns were in the Red (highest case rate) Zone (the previous week’s number was four) and 33 in the Orange (second highest case rate) Zone — the previous week’s number was four, including Old Lyme.
East Lyme* had reentered the Yellow (second lowest) Zone along with more than 50 other Connecticut towns.
All remaining towns in the state, including Lyme*, were in the Gray (lowest rate) Zone. This was the 20th straight week for Lyme in the Gray Zone.
July 29, 2021
The map above is from July 29, when four towns were in the Red Zone –Harland, Salem, Bozrah and Sprague — and four towns were in the Orange Zone — Easton, East Hampton, Ledyard and Thompson.
Old Lyme had reentered the Yellow (second lowest) Zone along with more than 50 other Connecticut towns. All remaining towns in the state, including Lyme, were in the Gray (lowest rate) Zone. This was the 19th straight week for Lyme in the Gray Zone.
July 15, 2021
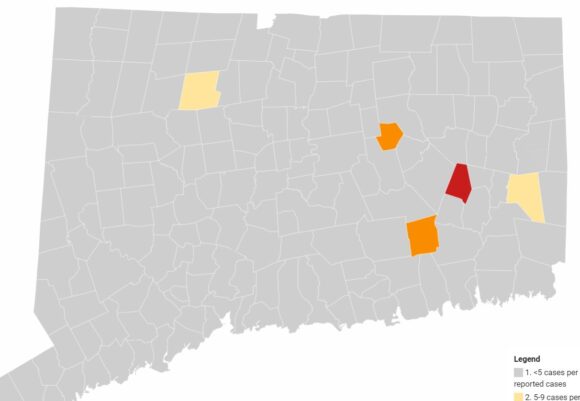
The map above is from July 15, when one town, Franklin, was in the Red Zone (indicating the highest rate of COVID-19 new cases) and another two, Salem and Andover, were in the (second highest rate) Orange Zone. New Hartford and Griswold were in the Yellow Zone (indicating the lowest but one rate of COVID-19 new cases.)
July 8, 2021
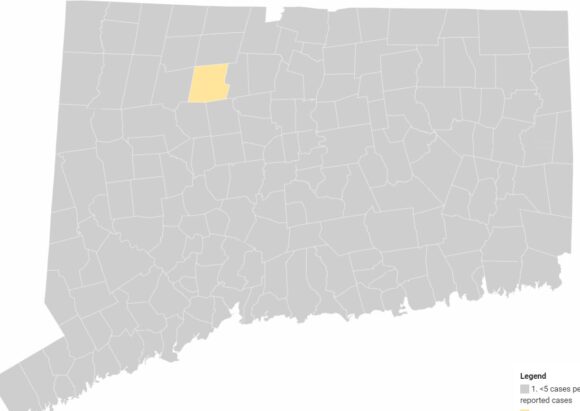
This map above dated July 8, shows New Hartford as the sole town in the Yellow Zone.
June 17, 2021
The map above dated June 17, shows when just one town, Bolton, was in the Yellow Zone.
Dec. 18, 2020