LYME/OLD LYME — UPDATED 11:40pm with LLHD latest data: The Daily Data Report for Connecticut issued Thursday, July 8, by the Connecticut Department of Public Health (CT-DPH) for data as at 8:30 p.m. Wednesday, July 7, shows that both Lyme and Old Lyme have each reported one new confirmed COVID-19 case. This takes Old Lyme’s cumulative total of confirmed cases to 342 and Lyme’s to 109.
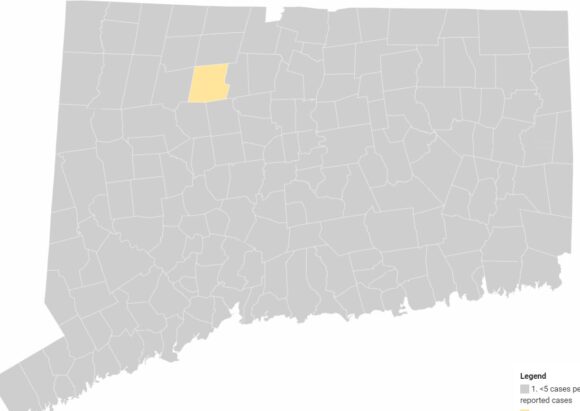
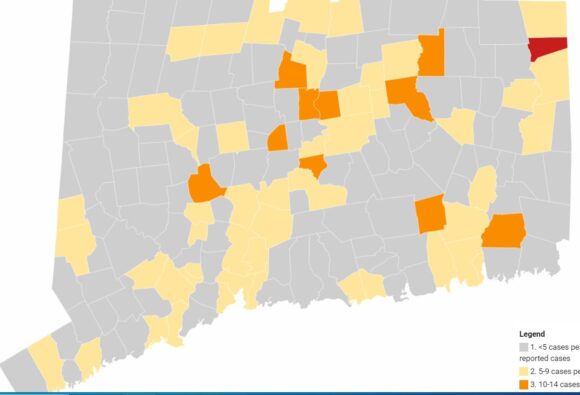
The report issued Thursday, July 8, by the Connecticut Department of Public Health (CT DPH) for the average daily rate of new cases of COVID-19 by town during the past two weeks (see map above) shows another improvement for the state as a whole over the previous week’s report with the number of towns in the Yellow Zone (indicating the lowest but one rate of COVID-19 new cases) reducing from two to one.
Last week Marlborough and Prospect were in the Yellow Zone; this week, the sole town in the Yellow Zone is New Hartford.
All the remaining 168 towns in Connecticut, including Lyme and Old Lyme, are in the Gray (lowest rate) Zone for two-week new case rates. It is the ninth week in succession for Old Lyme in that Zone, while Lyme is in the Gray Zone for a 17th straight week.
- The Gray category is defined as when the Average Daily Rate of COVID-19 Cases Among Persons Living in Community Settings per 100,000 Population By Town is less than five or less than five reported cases.
- The Yellow category is defined as when the Average Daily Rate of COVID-19 Cases Among Persons Living in Community Settings per 100,000 Population By Town is between five and nine reported cases.
- The Orange category is defined as when the Average Daily Rate of COVID-19 Cases Among Persons Living in Community Settings per 100,000 Population By Town is between 10 and 14.
- The Red category is defined as when the Average Daily Rate of COVID-19 Cases Among Persons Living in Community Settings per 100,000 Population By Town exceeds 15.
In all cases, this rate does not include cases or tests among residents of nursing home, assisted living, or correctional facilities.
The map below is from July 1, when Marlborough and Prospect were in the Yellow Zone.

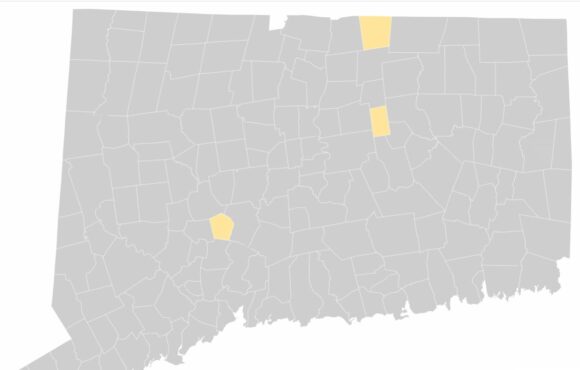
The map below is from June 24, when Somers, Prospect and Bolton were in the Yellow Zone.
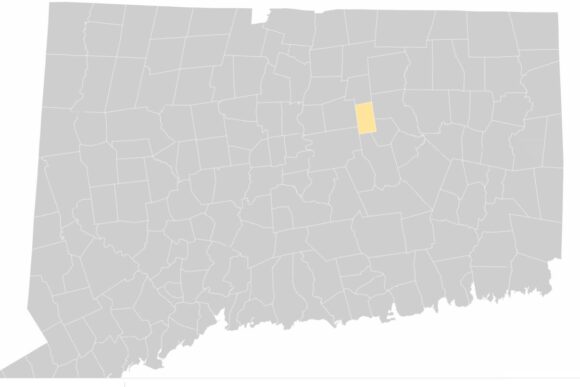
This is the June 17 map, when just one town, Bolton, was in the Yellow Zone.
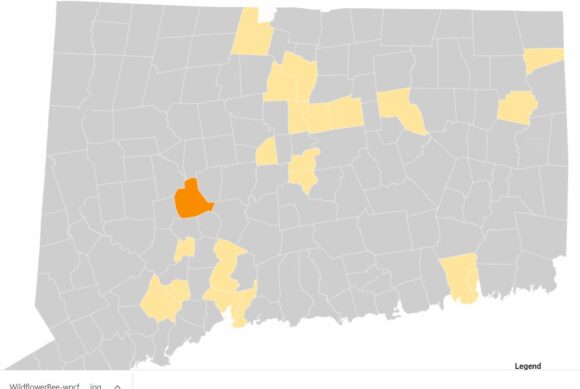
For comparison, the map below is from June 3 and shows one town, Waterbury, in the Orange Zone and 21 towns in the Yellow Zone, down from 48 the previous week. The towns in the Yellow Zone were: Ansonia, Beacon Falls, Bloomfield, Brooklyn, Coventry, Cromwell, Derby, East Hartford, East Haven, Granby, Hamden, Hartford, Manchester, New Britain, New Haven, New London, Putnam, Rocky Hill, Shelton, Waterford and Windsor.
Below is the map from May 27 that showed one town in the Red Zone, Putnam, and 10 towns in the Orange Zone.
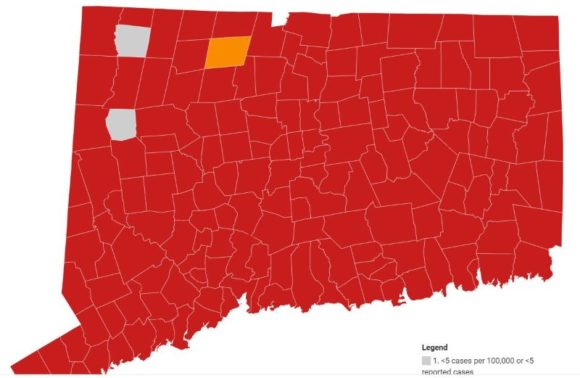
Compare the maps above with the one we published Dec. 18, 2020 to see the remarkable progress that has been made with controlling the spread of the virus through expansion of vaccination rates and improved mitigation strategies.
On July 9, Ledge Light Health District (LLHD) issued their latest weekly report of COVID data for the municipalities within their District. LLHD also announced this will be the final week that this report will be issued.
Seven towns in the nine-town district (which includes Lyme and Old Lyme) now report less than five new cases in the past two weeks. Both Groton and New London reported six cases apiece. Last week, all nine towns reported less than five new cases in the past two weeks..
Ledge Light Director of Health Stephen Mansfield prefaces the report with the comment, “We are happy to see low numbers throughout our jurisdiction, and encourage everyone to get vaccinated!”
He adds, “Information regarding vaccination opportunities and other relevant information can be found at https://llhd.org/coronavirus-covid-19-situation/covid-19-vaccine/
The following link provides centralized access to Connecticut COVID data: https://data.ct.gov/stories/s/COVID-19-data/wa3g-tfvc/
Vaccination rates in Lyme and Old Lyme are also extremely encouraging with 81.52 percent of the population in Lyme having received at least one dose of the COVID-19 vaccine and the equivalent number for Old Lyme being 73.21 percent.
Percentages for the fully vaccinated are 77.98 for Lyme and 69.24 for Old Lyme.
These rates remain among the higher percentages in the state.