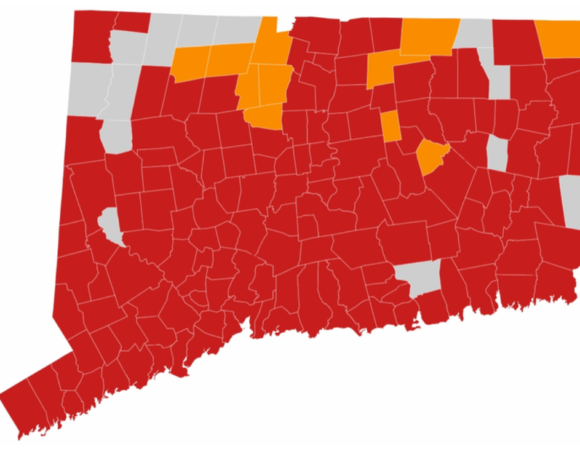
OLD LYME/LYME — In the Connecticut Department of Health’s map published Thursday (Nov. 19) showing, Average Daily Rate of COVID-19 Cases Among Persons Living in Community Settings per 100,000 Population By Town, Old Lyme is now in the red (highest) zone meaning the case rate is 15 or more cases per 100,000.
The actual rate for Old Lyme reported Nov. 19 is 18.4 per 100,000.
Old Lyme joins 144 other municipalities in the red zone, representing approximately 96 percent of the state. The previous week showed the number of towns in the red zone as 100.
The Town of Lyme, meanwhile, is in the grey (lowest) zone with less than five cases per 100,000.
The actual rate for Lyme reported Nov. 19 is 6.1 per 100,000.
Governor Ned Lamont, who is currently quarantined himself, described the surging virus statistics as, “disturbing,” during a news briefing yesterday. Visit this link for a full report published yesterday about Gov. Lamont’s news briefing by Hugh McQuaid of our LION partner CTNewsJunkie.com.
Ledge Light Health Department (LLHD) issued their weekly COVID report at 11:41 a.m. today. It shows Old Lyme as having 19 new cases in the past two weeks whereas Lyme had “<5”.
Old Lyme now has a cumulative total of 65 confirmed cases and two fatalities, while Lyme has a cumulative total of 17 confirmed cases and no fatalities. (The state report details the Lyme cases as 15 confirmed and two probable.)
A total of 620 PCR tests were administered to Old Lyme residents in the past two weeks with a positivity rate of 3.7, whereas the respective numbers for Lyme were 108 tests and a 2.8 positivity rate.
Stephen Mansfield, LLHD Director of Health, prefaces the report saying, “Our contact tracers continue to report that they have observed many cases associated with family and social gatherings; this is particularly concerning as we head into the holiday season.”
He adds, “We are also seeing a significant number of cases associated with sporting events, as well as person to person transmission within foodservice establishments; these foodservice cases have been almost exclusively employee to employee, rather than employee to patron.”
Finally, Mansfield notes, “Cases associated with schools and long-term care facilities are increasing as well.”
Although Old Lyme has moved from “orange” and has entered the “Red Zone”, there is still a little hope for all of us.
That said, I believe that it’s very important that we understand the data that underly that map.
In mid- October, CT DPH introduced a new weekly color-coded alert system to display and communicate community-based COVID-19 prevalence metrics to CT residents. The actual metrics help focus public health resources on problem areas; and should assist residents, town officials, and local institutions to make good and timely decisions.
As noted in the article, this system is based on local case rates (i.e., cases per 100,00 population).
So, communities with smaller populations, like Old Lyme, could experience, with only a relatively small increase in the number of new cases, a little more “bounce” between and amongst the colors on the map. You might think of it as “these little town blues”.
This is a very good way to display those rates. Of course, we also need to continue to follow the actual case numbers, which in some SE CT towns are now in triple figures, and the test positivity rates.
The link below will take you to the CT DPH site that discusses this new reporting system, and includes a very detailed, and helpful table with recommended community responses by resident risk group.
In conclusion, please also note CT DPH’s 3 W’s: “Wear your mask, Wash your hands, and Watch your distance!”
DPH Issues New Weekly COVID-19 Alert System with Guidance for Municipal Response (ct.gov)